Selected Work
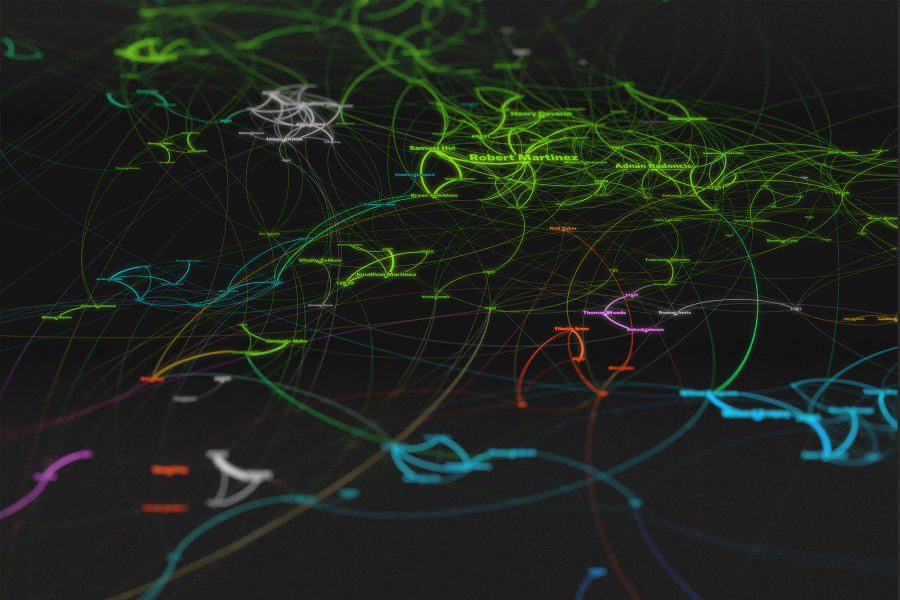
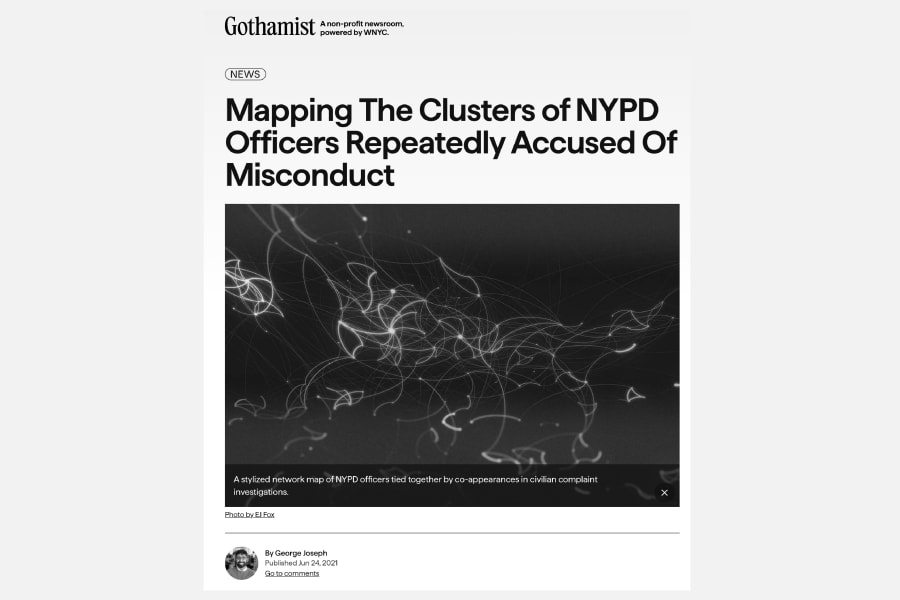
Clusters of NYPD Misconduct
client ↗In 2021, I got my hands on a massive NYPD complaint dataset from Gothamist/WNYC and immediately went down a data rabbit hole. Built a network of 29,915 officer nodes with 159,671 relationships using Neo4j and Gephi (love-hate relationship with Gephi, but unrivaled for networks).
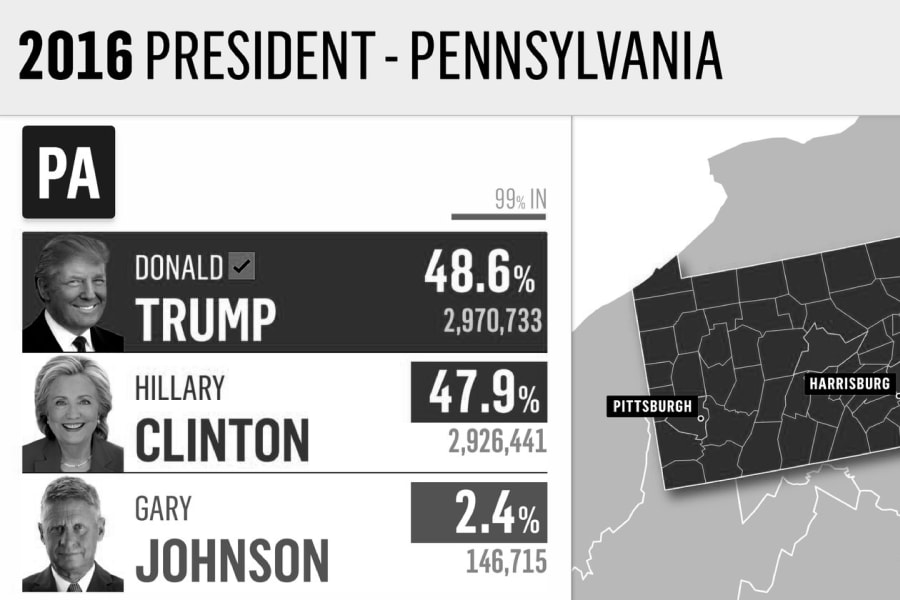
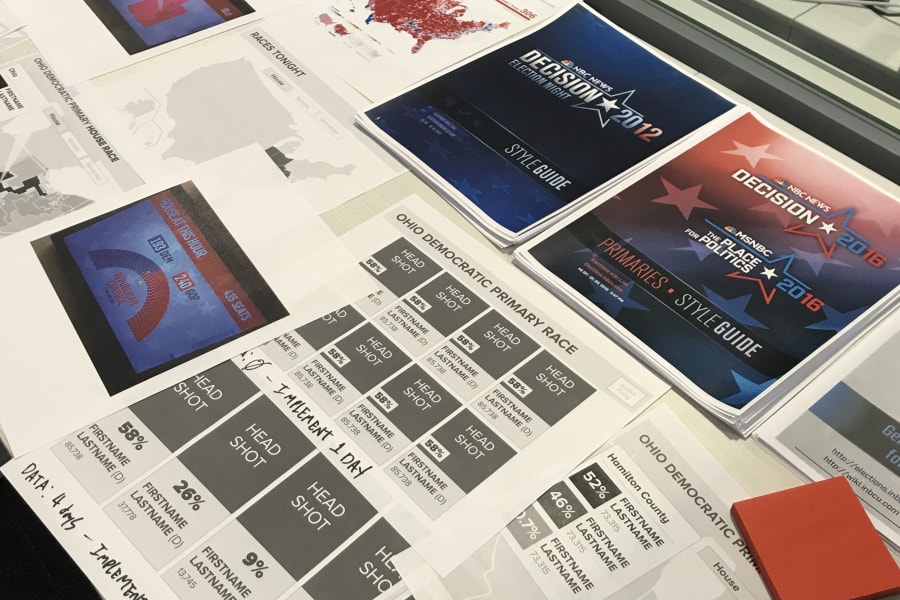
NBC News Big Board
clientI spearheaded an internal effort to develop new D3-powered mapping software for visualizing election maps and results live - the touchscreen app wielded by Steve Kornacki known as the "Big Board". Built for real-time county-level election analysis.


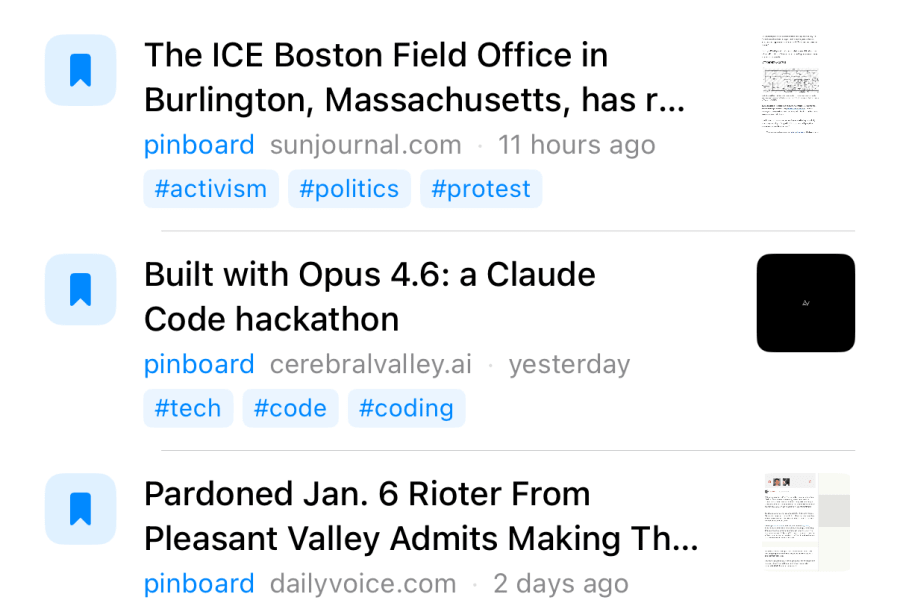
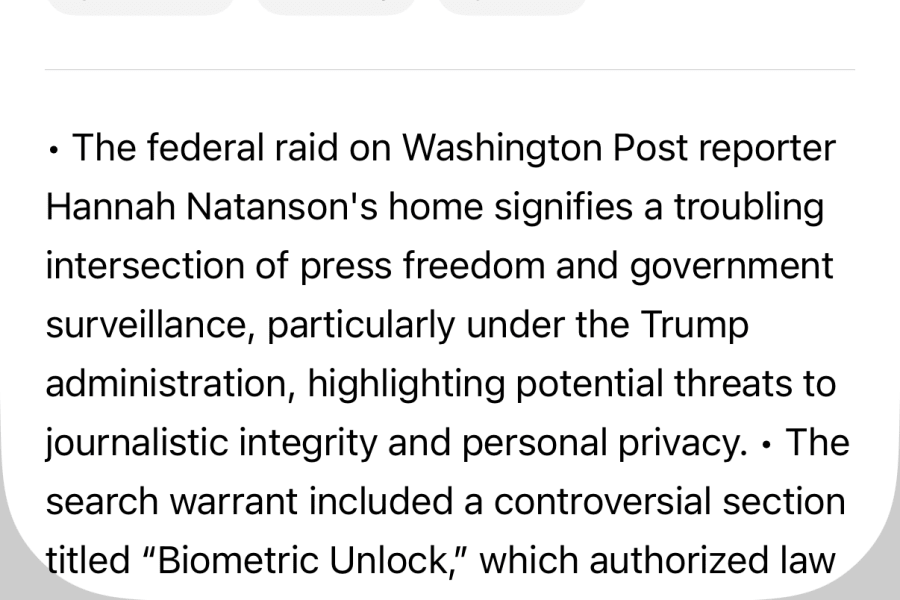
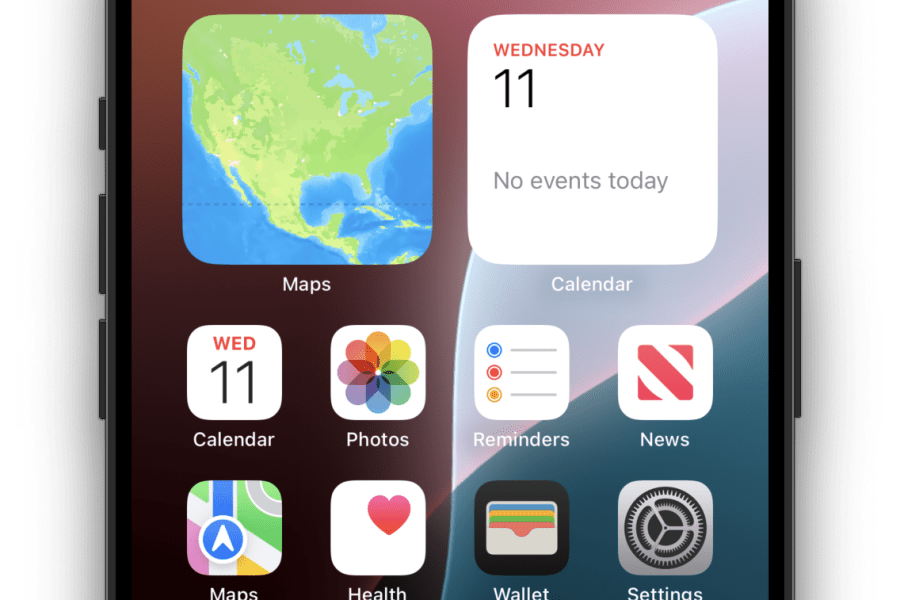
MorningRadio
personal ↗Designed to be a healthy "first screen" in the morning. News summaries, updates, and enough information about the latest events that you don't feel the need to endlessly doomscroll.

Smallbot MCP
personal ↗Smallweb is a really unique tool to create a filesystem based system for rapidly-deployed deno apps, and it pairs really well with a robot companion.


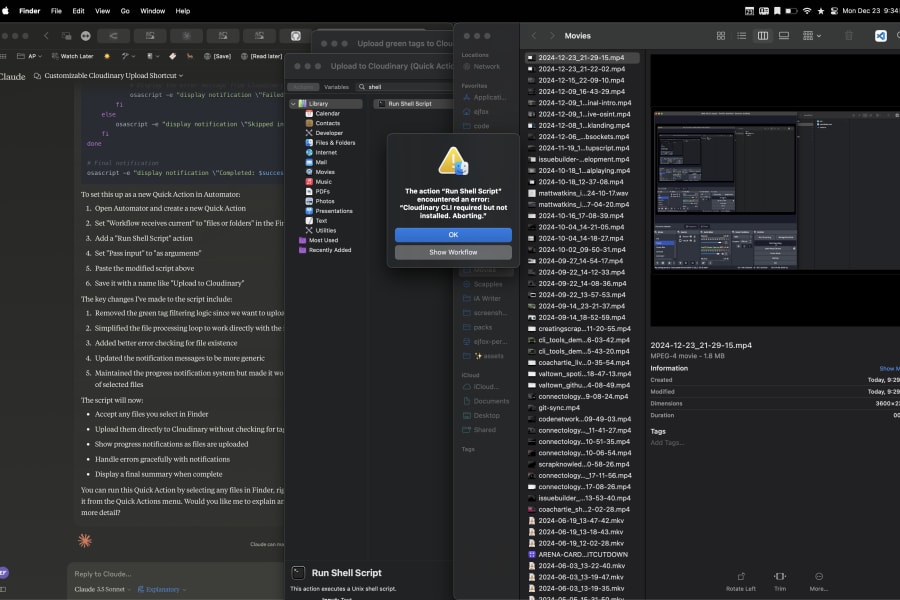
Cloudinary Backup Tool
personalI needed to backup thousands of photos from Cloudinary, and couldn't find an easy standalone tool to do so. So I built a little desktop app with Tauri. It handles batch downloads without eating all your RAM (vs an Electron app) and lets you resume if something goes wrong.


Hand-Tracking & Generative Art
personalThese are my attempts to make computers that respond to the way humans actually move and gesture—exploring the design space between human intuition and machine capability. Each project pushes beyond traditional HCI constraints to find new interaction models. Some of these work better than others, but they all represent steps toward interfaces that feel more like extensions of thought than barriers to it.

EXIF Printer
personalI love being able to reference the technical details when editing photography—aperture, shutter speed, ISO, all the little choices that go into making a photograph. But most photo prints completely ignore this data, treating it like metadata to be hidden away in EXIF tags that nobody ever sees. So I made a little app to add the EXIF data to the margins of prints you might get from CVS, Walgreens, or Wal-Mart (don't use them for photo prints, I learned the hard way.)


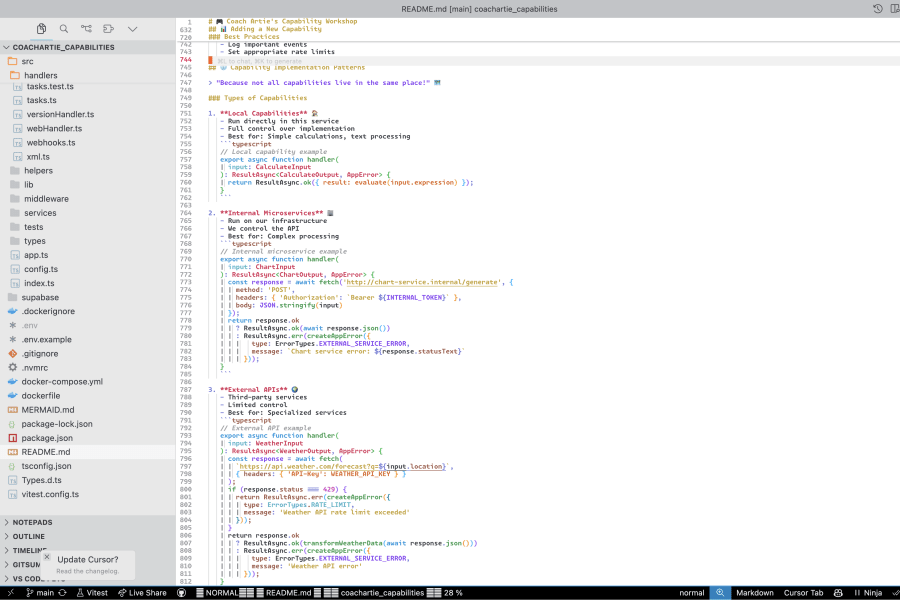
Coach Artie
collaborative ↗I created Coach Artie to serve as our Discord studio assistant. He's evolved into a powerful AI tool with persistent memory and tool usage - helping our team coordinate and manage creative workflows.


COVIDcast
client ↗During the early COVID-19 pandemic, I worked with Carnegie Mellon University's COVIDcast project, prototyping data visualizations and user interactions to help the public understand hospitalization, transmission, and movement trends across the country.


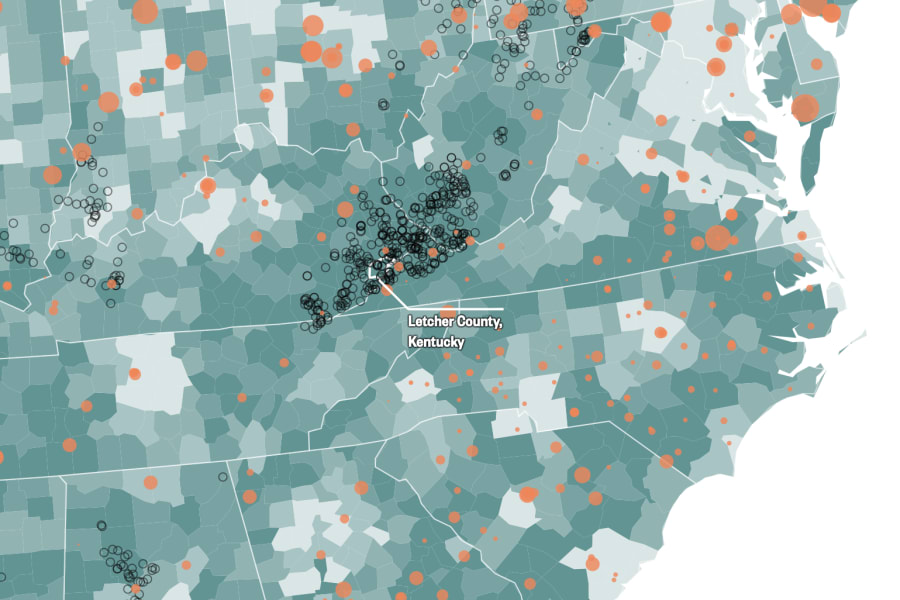
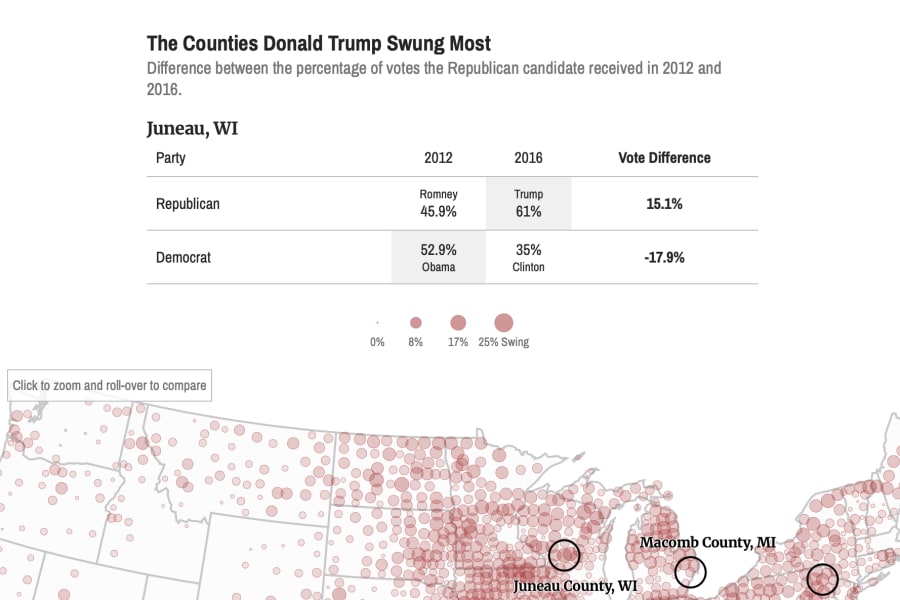
NBC News Specials
client ↗During my time at NBC News, I worked on the Foundry team, creating bespoke longform articles in collaboration with journalists across the organization. These specials focused on unique approaches to video, data visualiation, and storytelling on the web.

Dataproofer
collaborative ↗Along with Gerald Rich and the Vocativ data team, I received a Knight Prototype Fund grant to create Dataproofer - an open source tool to check data for reliability, missing data, and outliers. Built as an Electron desktop app for journalists.