OpenRouter Census
A full census of every model on OpenRouter, dumped into immutable JSONL/Parquet snapshots and rendered as an Observable Plot dashboard
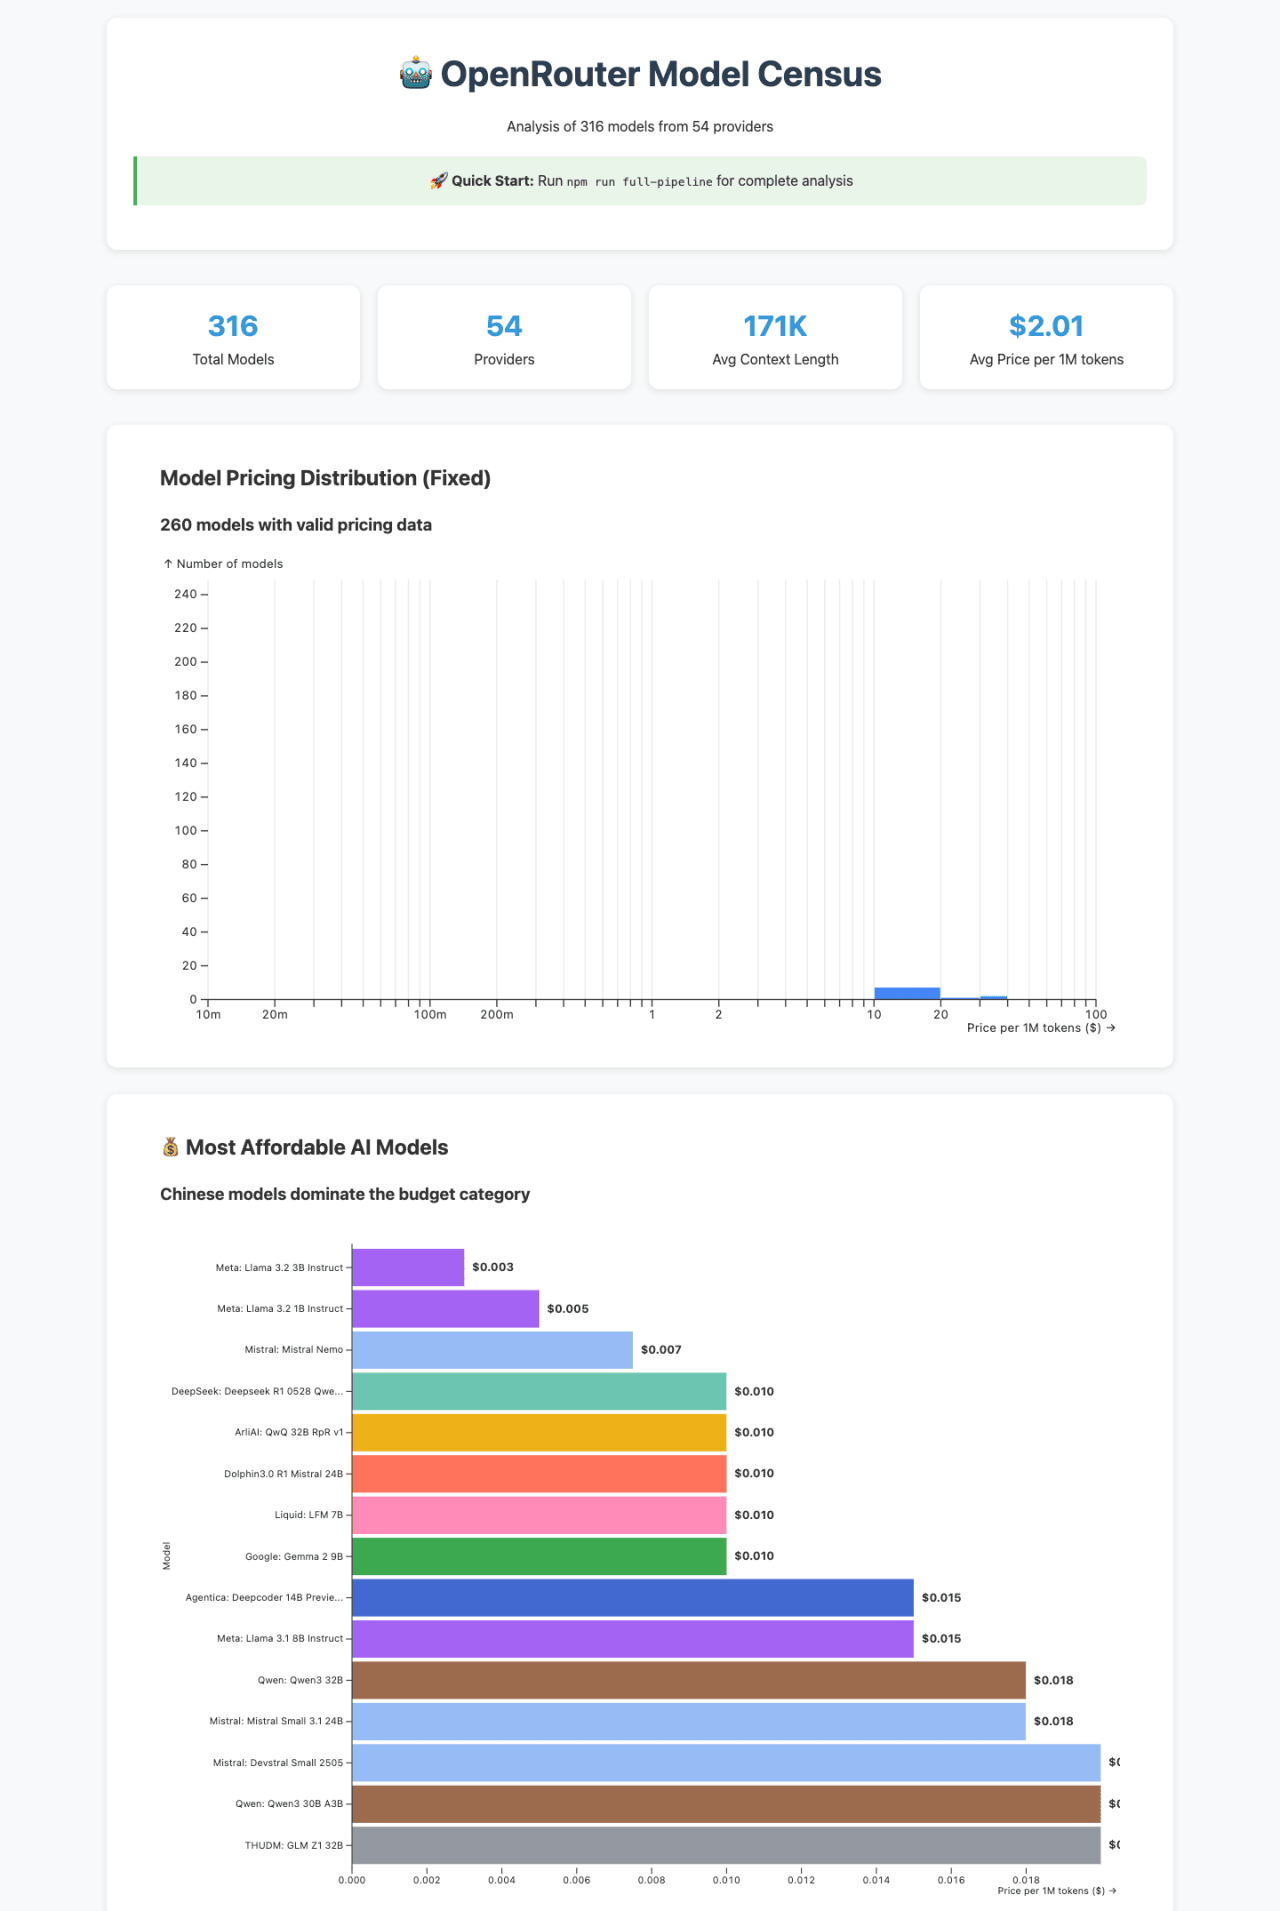
OpenRouter is the marketplace where you can hit basically any language model through one API, and the roster changes constantly — models appear, prices drift, a provider quietly bumps a context window. I wanted a way to take a dated snapshot of the whole thing and actually look at it, so I built a scraper that pulls all 316 models across 54 providers in about a second and hands me analysis-ready data I can chart.
The interesting part is what falls out once you have every model in one table. Median context length is 128K tokens but the average is 171K, dragged up by outliers like OpenAI's million-plus-token windows. 70% of the catalog is still text-only; the other 30% takes images. And the capability spread is uneven in ways the marketing never tells you — max_tokens is table stakes at 99.7%, but tool calling only shows up on about half the models, structured outputs on 45%, and reasoning tokens on 29%. That's the kind of thing you want to know before you pick a model to build on.
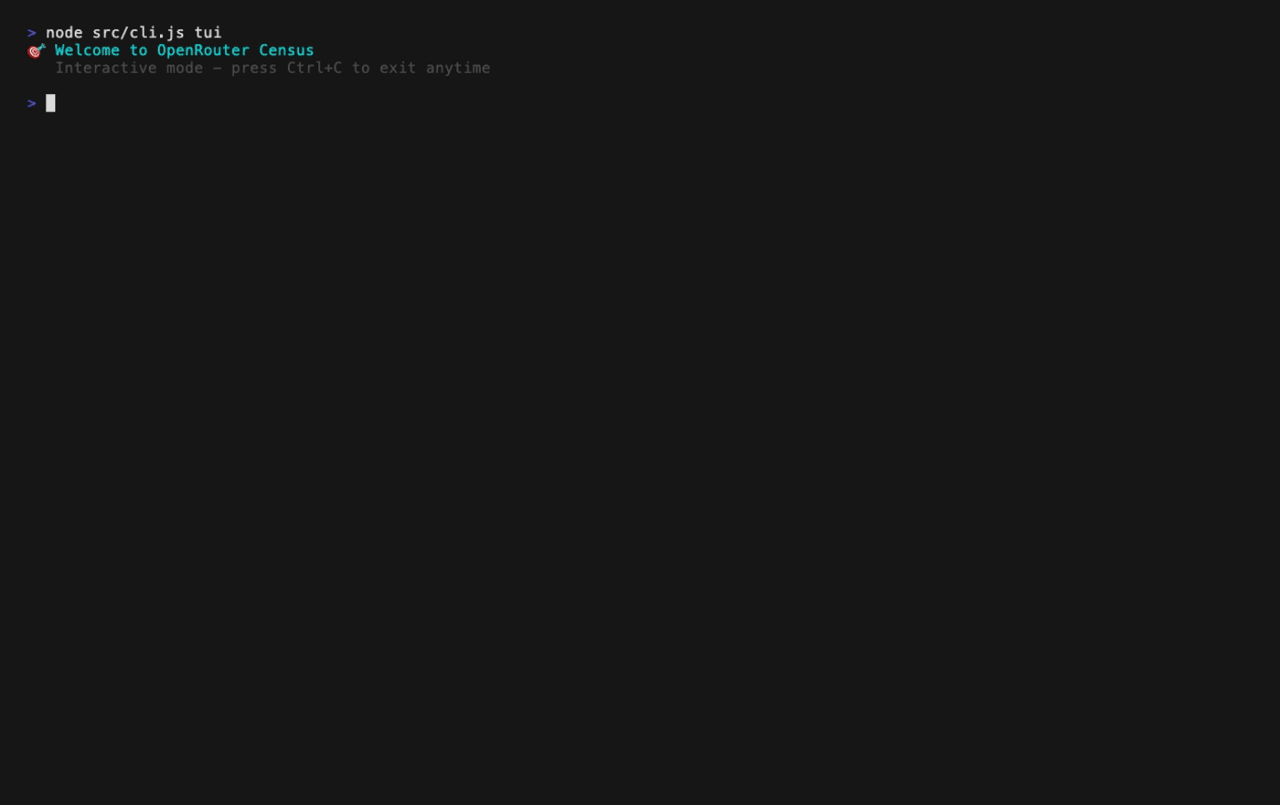
I care about provenance more than a leaderboard, so every run writes a dated artifacts/ directory: raw unmodified API payloads next to the normalized tables, JSON Schemas, SHA-256 checksums, fetch metadata, and a CITATION.cff — so a snapshot is something you can actually cite and reproduce, not a screenshot that rots. There's an interactive TUI for browsing and filtering, and the dashboard is seven Observable Plot charts over the processed data.