Obsidian Analysis
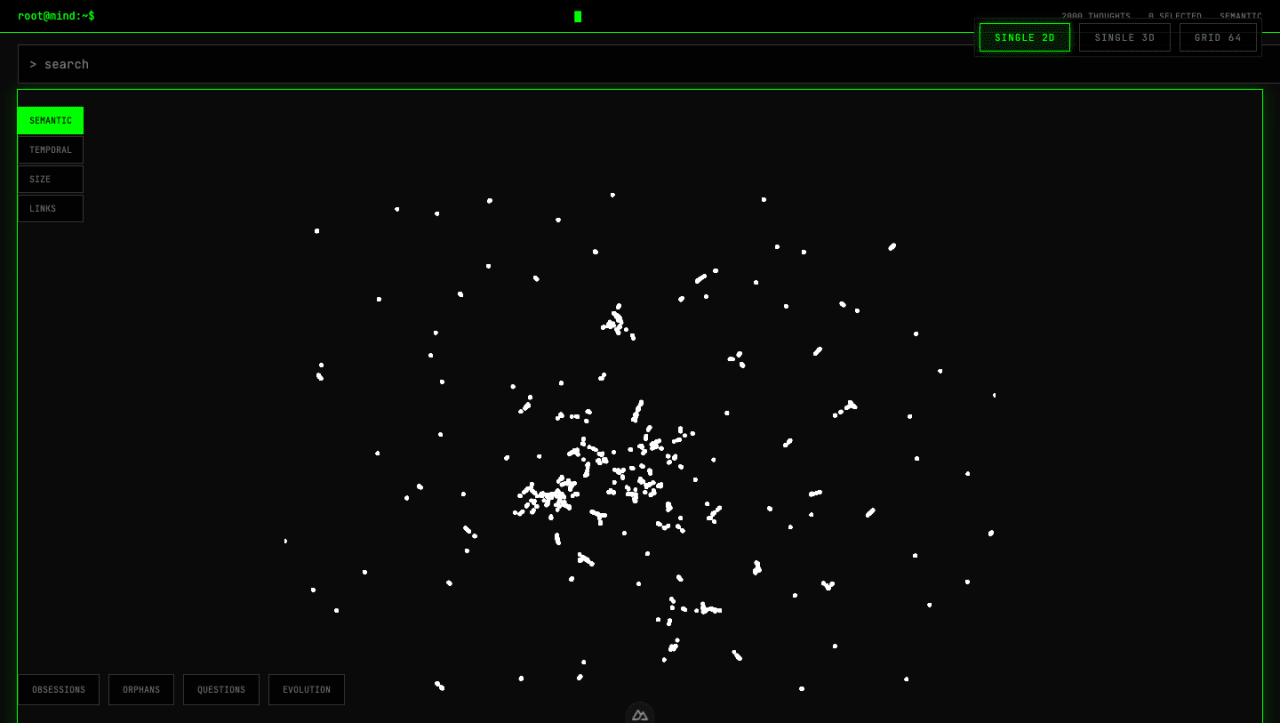
I embedded my entire Obsidian vault — around 2,000 notes, chunked — using local Nomic embeddings running in LM Studio, so my private notes never leave my machine, and then I laid the whole thing out as a semantic map. Every note is a point, and points that sit close together are notes that are actually about the same thing. You search it in plain natural language, and you can recolor the map by semantics, recency, note size, or link density to see the vault from a different angle each time.
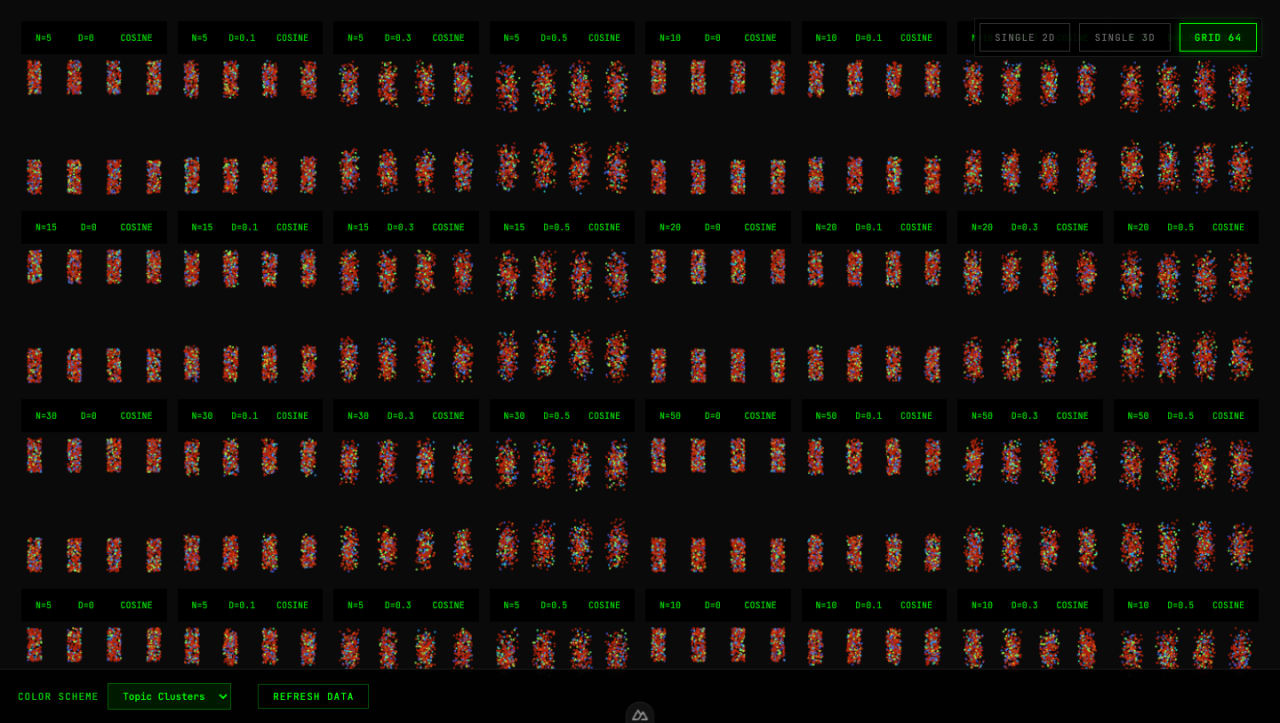
The other half of this is the parameter grid. UMAP has a lot of knobs and the layout you get depends entirely on how you set them, so instead of guessing I ran 64 combinations of n_neighbors and min_dist at once and put them side by side. It turns "which settings are right" into something you can just look at — the same vault laid out 64 different ways, all on one screen.
More semantic maps
Criterion Embeddings
Criterion Embeddings computes vector embeddings for every Criterion Collection film and projects them into an explorable 2D map. You search by theme ("films about existentialism") instead of by keyword.
r/dataisbeautiful, Embedded
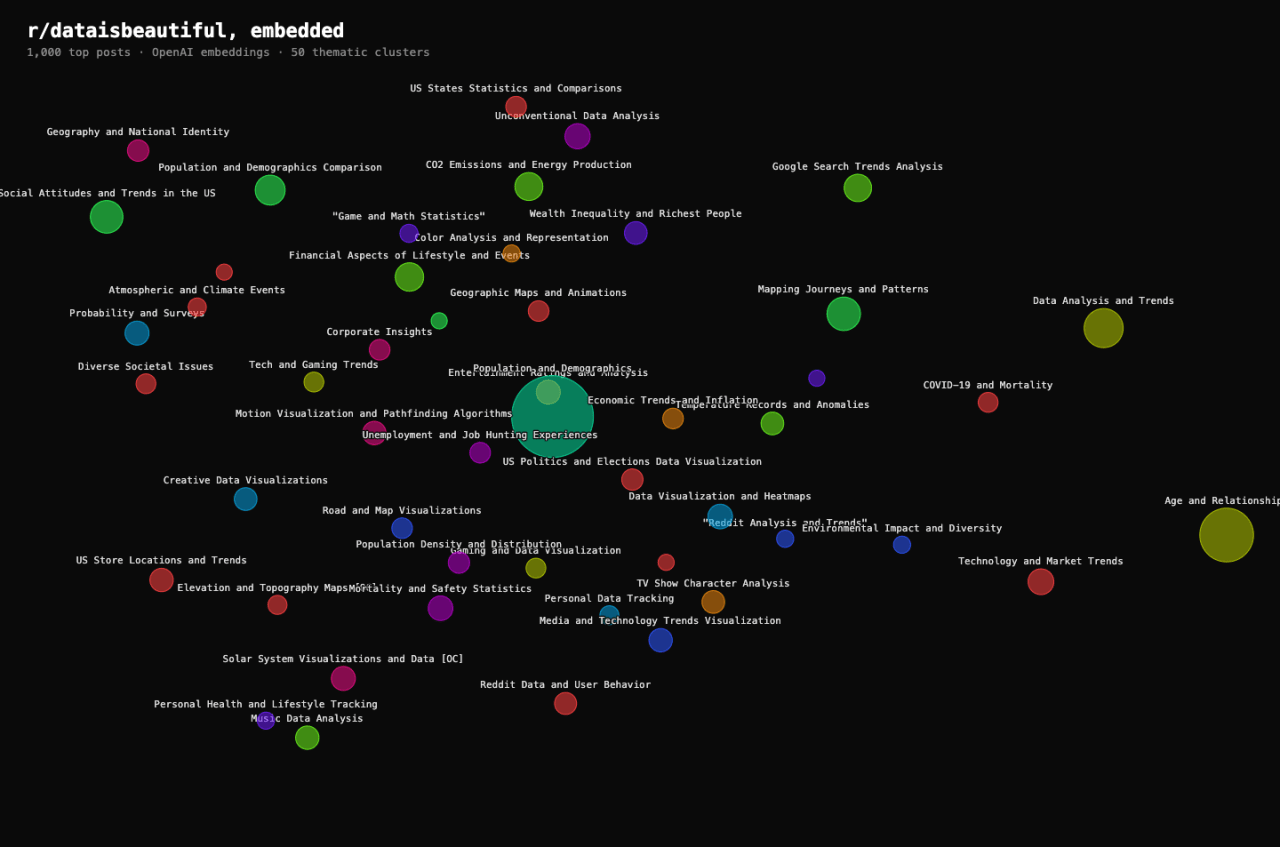
The top 1,000 posts from r/dataisbeautiful, each embedded with OpenAI and clustered into 50 themes, laid out as a map. The biggest clusters: US politics dataviz, COVID and mortality, Google search trends, climate, creative visualizations, and personal-finance charts.
code-network-gen
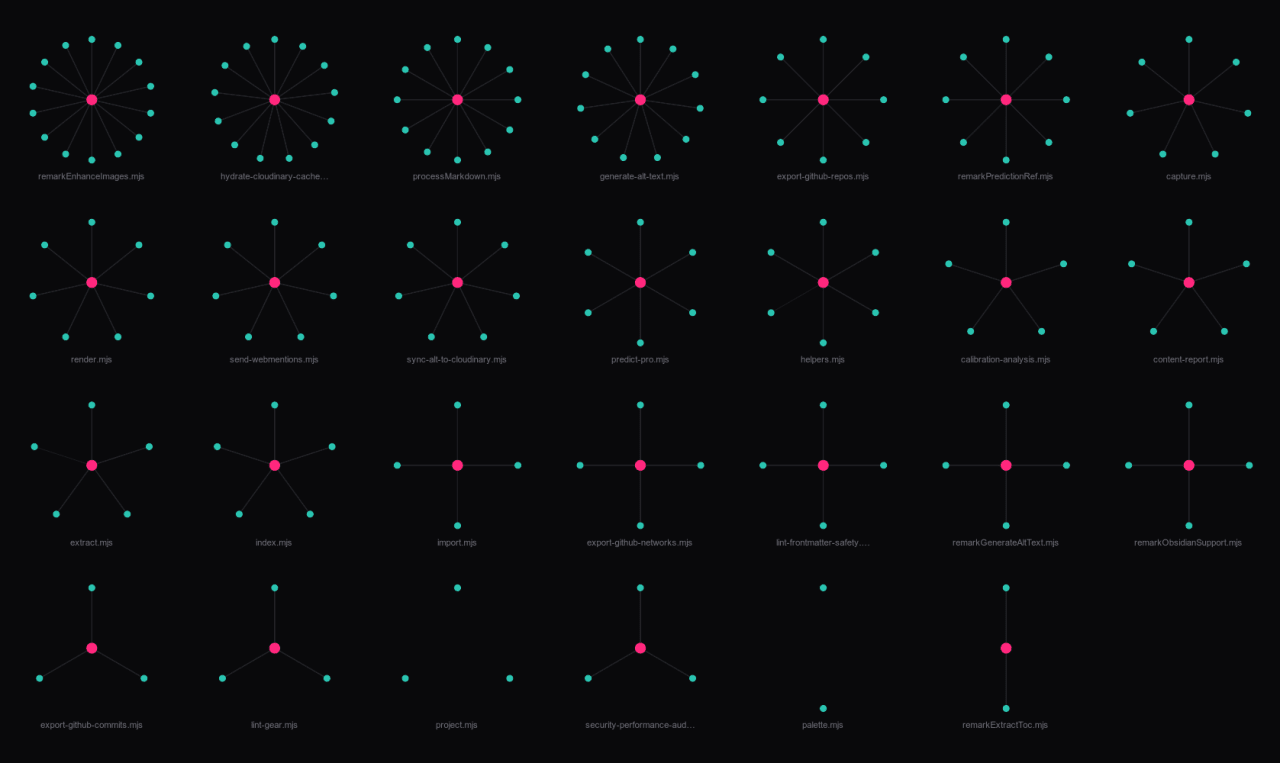
code-network-gen generates a node/edge graph from a JavaScript codebase by walking the AST with acorn and babel. It shows software architecture as an explorable network instead of a file tree — above, the scripts behind this site's own content pipeline.