Motorcycle Meta-Visualizations
I started filming my rides in case something went wrong. A helmet cam is insurance — if an accident or something crazy happened, at least there'd be a tape. But over a few years the reason quietly changed on me. I'd flip it on for the beautiful stuff instead: a good stretch of road, the light, whatever cool thing was happening. One time I caught a train and a helicopter lining up over the Hudson River exactly as I rode past.
By the end of those first few years I had gigabytes and gigabytes of it, and I got curious what all of it looked like at once — what years of riding might add up to. So I ran the whole corpus through a battery of meta-visualization techniques, pulling images out of the footage that no single frame holds.
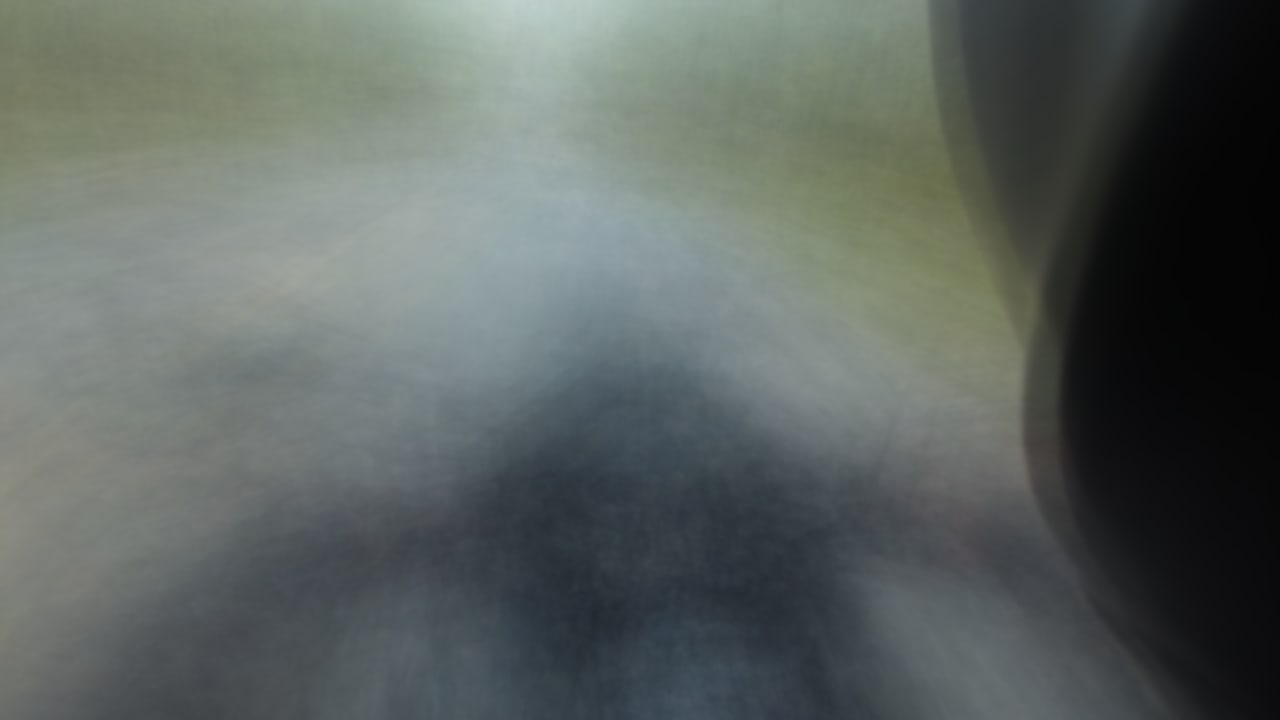
Frame averaging (after Jason Salavon) stacks thousands of frames into one — the constants of riding (road below, sky above, the fairing) resolve into a soft ghost while everything transient blurs away. Run it per year and you can watch the ghost shift as the routes and seasons change:

Slit-scan takes a single column from every frame and lays them side by side, turning a whole ride into a striated band of color and light — both horizontally and vertically.


Cinema redux shrinks every frame to a tile and tiles them into a single mosaic — the entire footage archive as one dense image, a barcode of where I've been.
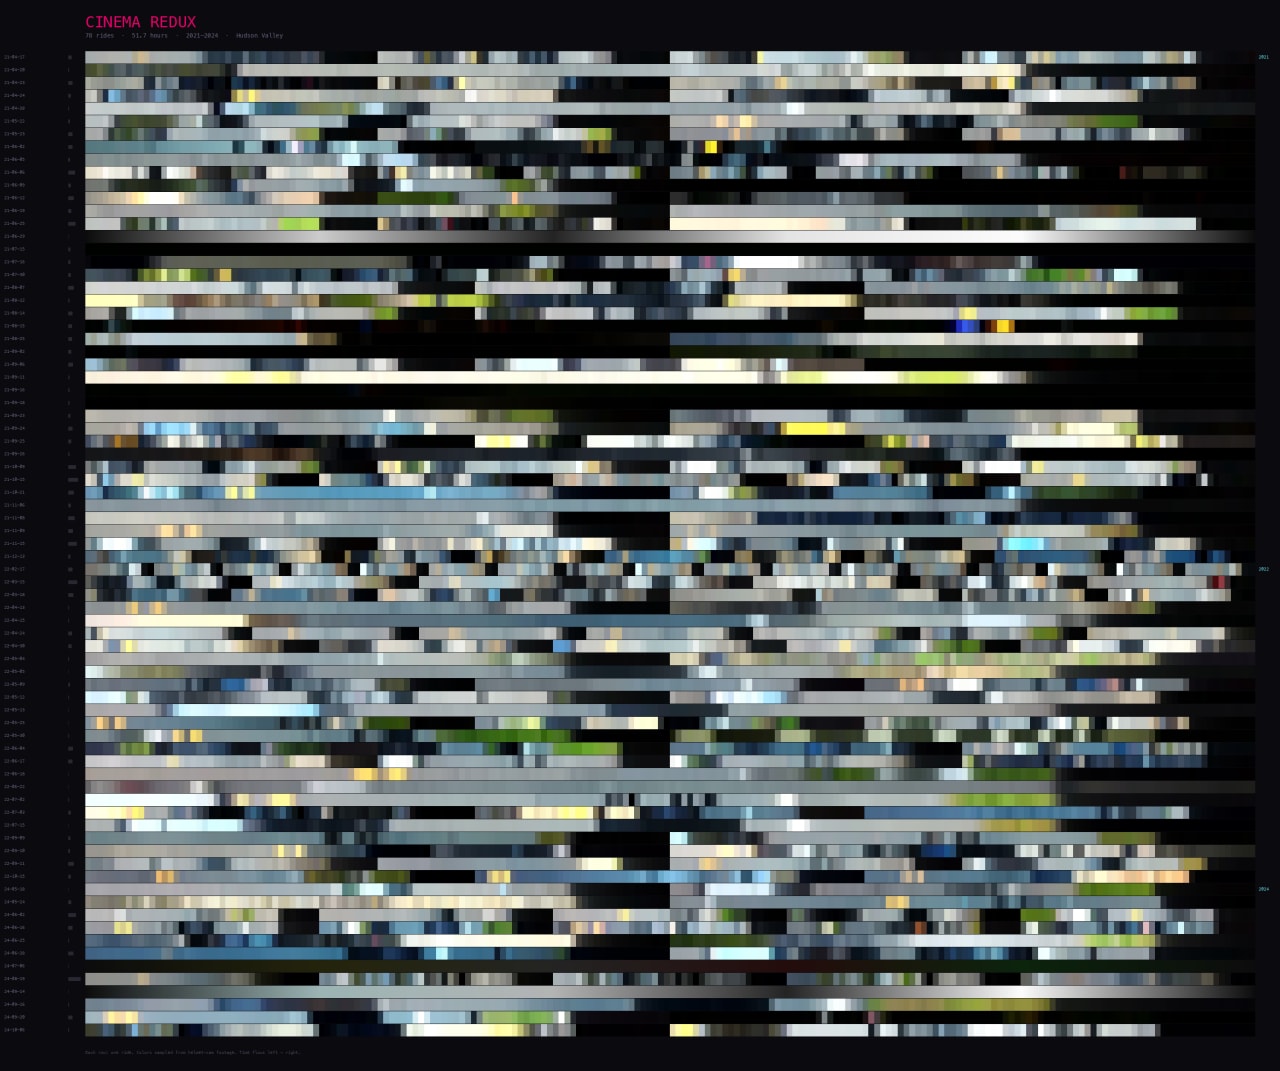


So what did it all add up to? Honestly, not much you could point at. The specific moments I'd gone looking for — the train and the helicopter, the good light — washed out in the averaging. What was left was just the general shape and colors of the Hudson Valley and its roads. Unremarkable, but with a kind of haunting beauty to it. A consistency.
The real blessing turned out to be in what isn't there. Across all of it — every gig of footage, every year — no accident, nothing terrible ever happened. The insurance I started rolling never had to pay out. That's the thing the average quietly confirms.
Mapping the rides
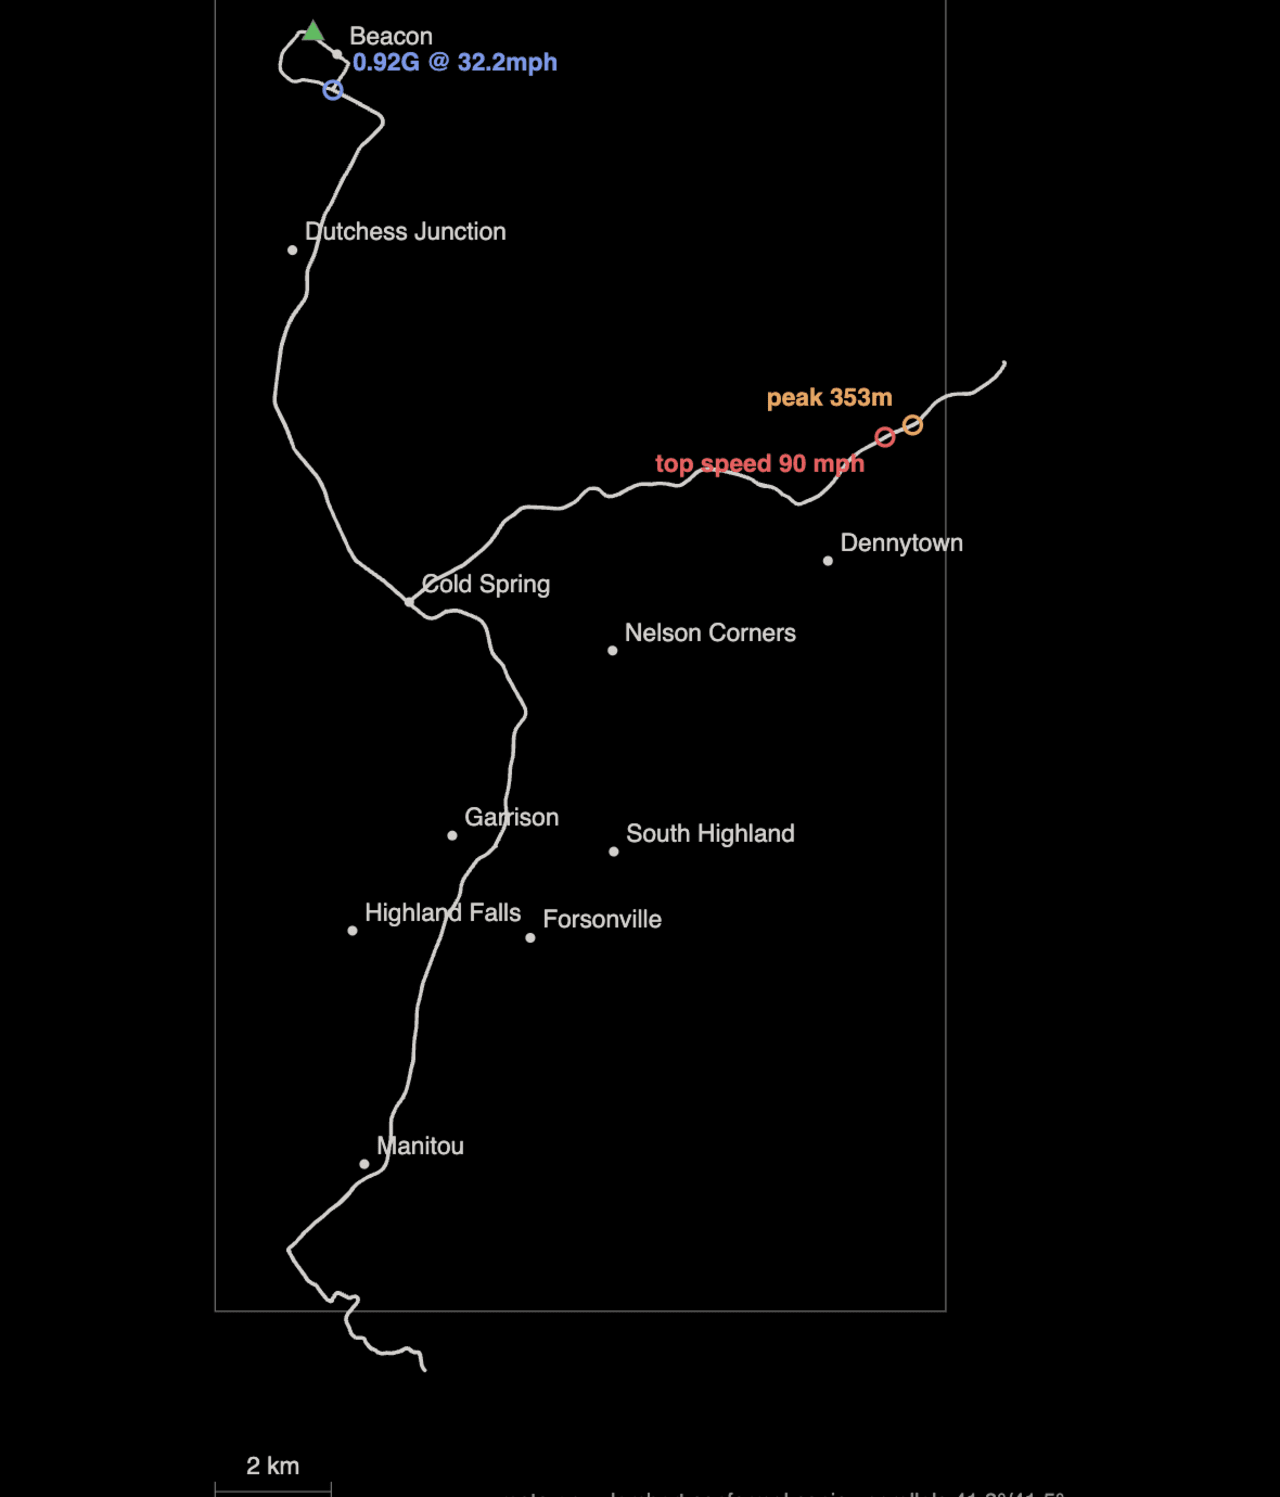
Moto GPX dumps a folder of GPX tracks into map-ready GeoJSON split by day, hour, or stage, and can merge photos and videos in via exiftool. It also generates elevation and speed profiles, with the day's peak and top-speed moment marked.